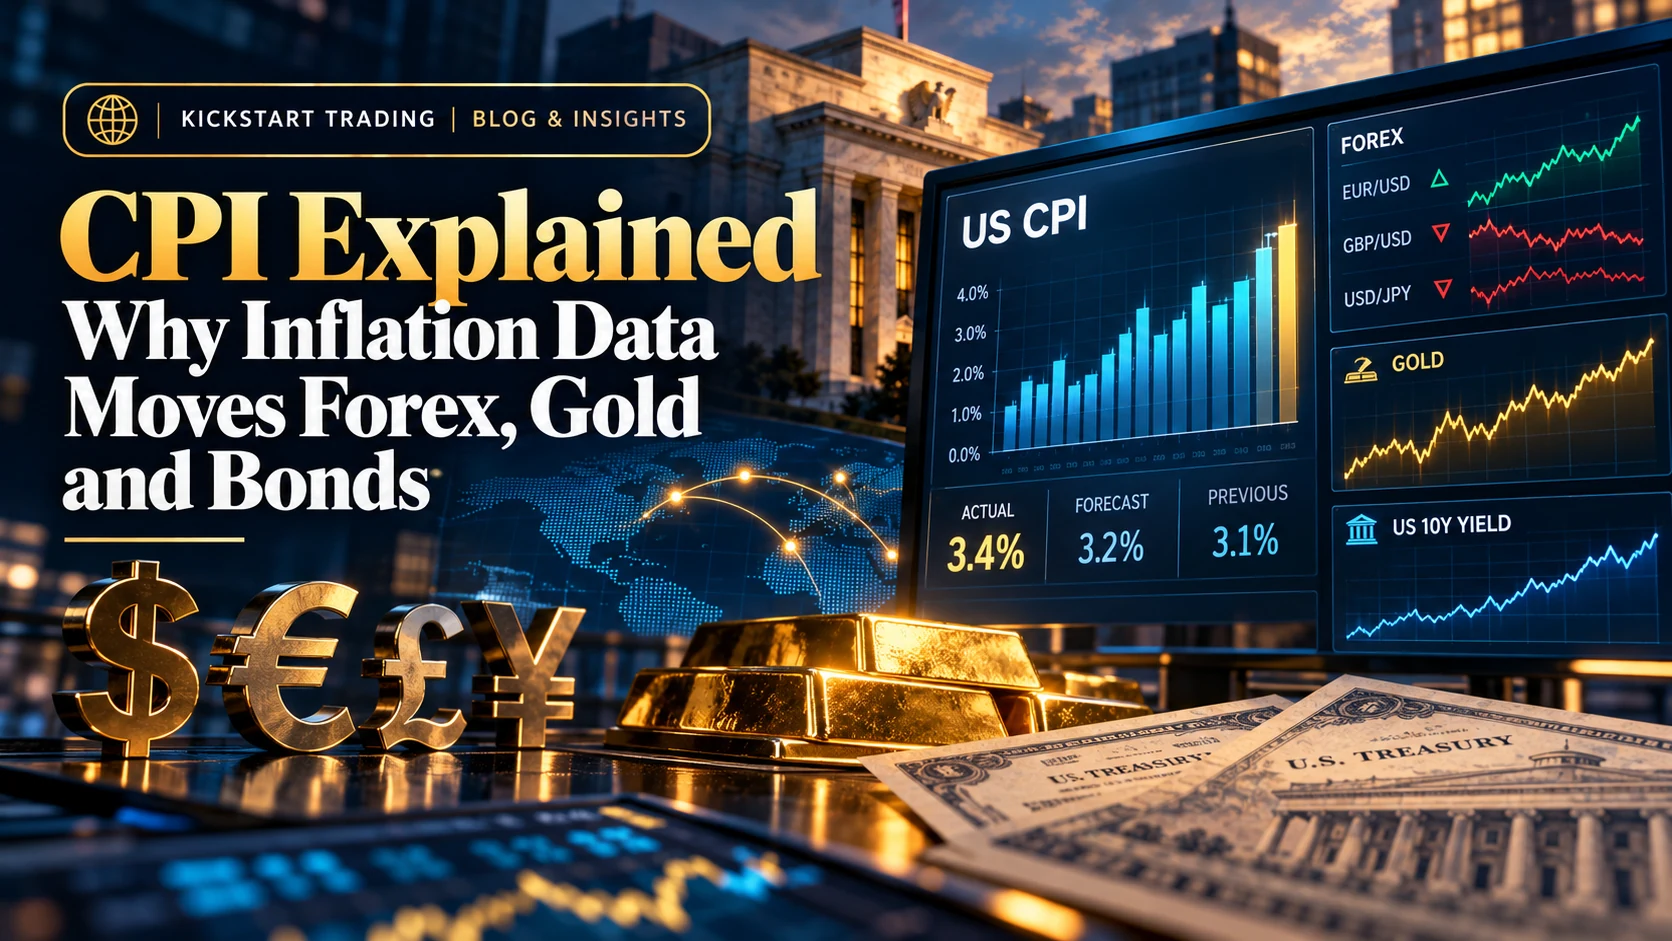
CPI Explained: Why Inflation Data Moves Forex, Gold and Bonds
Tomorrow, the United States releases one of the most market-sensitive numbers on the economic calendar.
The Consumer Price Index.
CPI sounds simple enough. It measures inflation.
But if you trade forex, gold, indices, bonds, or almost anything affected by interest rates, the number itself is only the beginning.
Markets care about what changed, where the inflation came from, how the result compares with expectations, and what it could mean for the Federal Reserve.
That is why you can sometimes see a headline CPI number rise while the dollar falls. Or inflation come in lower than the previous month while Treasury yields jump. Or gold initially spike in one direction and reverse minutes later.
The market is not simply reacting to whether inflation is “high” or “low.”
It is repricing the path of interest rates.
And that distinction matters.
Current context, October 13, 2026: The Bureau of Labor Statistics is scheduled to release September CPI at 8:30 a.m. Eastern Time on October 14, which is 1:30 p.m. UK time. Consensus forecasts are centred around a sharp rise in headline inflation, driven largely by energy, while core inflation is expected to remain considerably calmer. This is the final CPI release before the Fed’s October 27-28 meeting.
If you read my breakdown of the Fed’s September 2026 rate hike, this is the next piece of that story.
The Fed has already tightened policy once. Now the market wants to know whether inflation gives policymakers a reason to do it again.
What CPI actually measures
The Consumer Price Index measures changes in the prices consumers pay for a basket of goods and services.
The US Bureau of Labor Statistics collects prices across categories including:
- housing
- food
- energy
- transport
- medical care
- clothing
- recreation
- education
- communication
- other consumer goods and services
The most widely quoted version is CPI-U, the Consumer Price Index for All Urban Consumers. According to the BLS, that population represents more than 90% of the US population.
The important word here is change.
CPI is not telling us whether something is expensive in an absolute sense.
It is telling us how quickly the price level is changing.
If a basket that cost $100 a year ago now costs $103.50, that implies roughly 3.5% inflation across that basket.
That sounds straightforward, but the market immediately asks several more questions.
Was the increase expected?
Was it driven by petrol?
Was shelter still sticky?
Did services accelerate?
Was the monthly figure stronger than the annual figure suggests?
Is the trend broadening or narrowing?
Those details can matter much more than the headline alone.
The BLS publishes the official CPI data and methodology directly at bls.gov/cpi.
Headline CPI versus core CPI
This is one of the first distinctions every trader should understand.
Headline CPI includes everything in the basket, including food and energy.
Core CPI removes food and energy.
That does not mean food and energy “do not count.” They absolutely do. They are real household costs, and the BLS continues to include them in headline inflation.
Core CPI exists because food and energy prices can be extremely volatile.
Oil can jump because of war, supply disruption, weather, sanctions, production policy or shipping problems. Agricultural prices can move because of drought, disease or harvest conditions.
Those shocks matter to households, but they do not always tell policymakers much about the persistent underlying inflation trend.
That is why traders usually watch both numbers.
A hot headline number driven almost entirely by energy is different from a hot core number driven by shelter, services and a broad range of consumer categories.
The Federal Reserve makes the same distinction. It monitors headline inflation because people actually pay headline prices, but it also studies core measures to help identify persistent inflation trends. The Fed explains that approach directly in its inflation FAQ.
Why tomorrow’s report is particularly interesting
August CPI already showed the tension between headline inflation and underlying inflation.
According to the BLS:
- headline CPI rose 0.4% month over month
- headline CPI was 3.4% higher than a year earlier
- core CPI rose 0.3% month over month
- core CPI was 2.4% higher than a year earlier
Energy did a lot of the work.
Gasoline prices rose 3.9% in August and accounted for more than one-third of the monthly increase in headline CPI. The broader energy index rose 2.1% that month.
September is expected to show an even stronger headline effect.
Economists surveyed ahead of the release are broadly looking for headline CPI to rise around 0.6% for the month and roughly 3.6% to 3.7% over the year. Core CPI is expected around 0.2% for the month and approximately 2.4% to 2.5% over the year.
That expected split matters.
If headline inflation accelerates sharply but core remains relatively contained, the market may conclude that much of the increase is an energy shock rather than a broad reacceleration in underlying inflation.
If core CPI also surprises to the upside, the interpretation becomes much more difficult for the Fed.
And that is where markets can move very quickly.
Month over month versus year over year
Another common mistake is looking only at the annual number.
The market watches both.
Year-over-year CPI
This compares the current price index with the same month one year earlier.
It is useful because it gives us a broad picture of inflation over time.
But it can sometimes change because an old month drops out of the comparison, not just because something dramatic happened in the latest month.
That is called a base effect.
Month-over-month CPI
This measures the change from the previous month.
It gives traders a much more immediate look at current inflation momentum.
A monthly reading of 0.2% and a monthly reading of 0.5% can point to very different underlying trends even if the annual figures still look similar.
This is why experienced market participants often pay close attention to the monthly core number.
If core CPI repeatedly prints at 0.3% or 0.4% month after month, that can imply annualised inflation running materially above the Fed’s target even before the year-over-year figure fully reflects it.
Conversely, a softer run of monthly readings can suggest inflation is cooling before the annual number falls significantly.
Why CPI moves interest-rate expectations
This is the transmission mechanism that matters most for traders.
The Fed’s job includes maintaining price stability.
When inflation is persistently too high, tighter monetary policy becomes more likely.
When inflation is moving convincingly toward target, the Fed has more freedom to hold or eventually reduce rates.
So when CPI is released, the market immediately recalculates questions like:
- Is another Fed hike more likely?
- Is a pause more likely?
- How high might rates ultimately go?
- How long might they stay there?
- Has the probability of future cuts moved further away?
Those expectations feed directly into the bond market.
And from there, they spread across currencies, gold, equities and credit.
The key is that markets price the future, not just the current policy rate.
The surprise matters more than the number
Imagine CPI comes in at 3.7% year over year.
Is that bullish or bearish for the dollar?
You cannot answer that from 3.7% alone.
If markets expected 3.4%, then 3.7% is a meaningful upside surprise.
If markets expected 4.0%, then 3.7% is actually softer than expected.
Same number.
Completely different information.
This is one of the most important ideas in macro trading.
Markets move on the difference between expectation and reality.
That is why economic calendars show three columns:
Previous. Forecast. Actual.
The previous number gives context.
The forecast tells us what the market broadly expects.
The actual number tells us what happened.
The initial price reaction often reflects the gap between forecast and actual.
Then the market starts reading the details.
Why Treasury yields often move first
If CPI is hotter than expected, traders may price a higher path for Fed rates.
That can push Treasury yields higher.
If CPI is softer, yields may fall as markets price less tightening or more eventual easing.
The front end of the yield curve is particularly sensitive to Fed expectations because shorter-dated Treasury yields are closely tied to the expected policy path.
Longer-dated yields can also move, but they have more moving parts.
They reflect not only Fed policy expectations but also:
- long-term inflation expectations
- economic growth
- government borrowing
- term premium
- global demand for safe assets
- fiscal conditions
That is why a CPI release can sometimes produce very different moves in the 2-year and 10-year Treasury yields.
For a forex trader, watching yields can help explain what the currency market is doing.
If the dollar spikes after CPI and US yields are simultaneously moving sharply higher, there is usually a coherent macro story behind the move.
Why CPI moves the US dollar
The dollar is affected by the relative attractiveness of US assets.
If hotter inflation causes markets to expect higher US interest rates, US yields can become more attractive relative to yields elsewhere.
That can support the dollar.
A simplified chain looks like this:
- CPI surprises higher.
- Traders price a more hawkish Fed path.
- Treasury yields rise.
- US interest-rate differentials improve relative to other economies.
- Dollar demand strengthens.
But again, nothing in markets is automatic.
If inflation is high because of a negative energy shock that also damages the growth outlook, the dollar reaction can become more complicated.
If the Fed has already signalled that it will look through a temporary energy spike, the market may care more about core CPI.
If the dollar has rallied aggressively before the release, even a hot number may fail to produce much additional upside if the surprise is not large enough.
Context matters.
EUR/USD and rate differentials
EUR/USD is a particularly useful example because you are trading two monetary-policy paths against each other.
A hot US CPI number does not exist in isolation.
You have to ask what it means for the Fed relative to the European Central Bank.
If US inflation forces the Fed toward tighter policy while European data pushes the ECB toward easier policy, the rate differential can move strongly in favour of the dollar.
That can pressure EUR/USD.
If US inflation surprises lower while European inflation remains firm, the differential can move the other way.
This is why major FX pairs are ultimately relative-value trades.
One economy can be weak and its currency can still rise if the other side of the pair deteriorates faster.
Why gold can react violently
Gold sits at the intersection of several CPI-sensitive forces.
A hot inflation print can initially sound bullish for gold because gold is often described as an inflation hedge.
But that is only one part of the equation.
Hotter inflation can also mean:
- higher Treasury yields
- higher real yields
- a more hawkish Fed
- a stronger US dollar
Those forces can be bearish for gold because gold itself pays no interest and is priced globally in dollars.
So the immediate reaction often depends on which force dominates.
That is why you sometimes see gold fall on a hot CPI print even though inflation itself has risen.
And it is why XAUUSD can become extremely volatile around the release.
If you trade gold, the mechanics of the macro story matter, but so does basic account protection. I covered that separately in Trading Gold: Why XAUUSD Requires Serious Risk Management.
Why equities care about CPI
Equity traders care because interest rates affect valuation.
When bond yields rise, the discount rate applied to future corporate cash flows also rises.
That can be particularly difficult for companies whose valuations depend heavily on profits expected far into the future.
That is one reason growth and technology stocks can react sharply to inflation surprises.
But there is another layer.
Inflation can also affect:
- company input costs
- consumer purchasing power
- wage pressure
- profit margins
- borrowing costs
- economic growth
So a CPI release can hit equities through several channels at once.
Sometimes the market likes a softer inflation print because it reduces rate pressure.
Sometimes it dislikes the same soft print because investors interpret it as evidence that demand is weakening too quickly.
Again, context.
CPI is not the Fed’s official inflation target
This is worth clearing up because it causes a lot of confusion.
The Federal Reserve’s 2% inflation objective is defined using the Personal Consumption Expenditures price index, or PCE, not CPI.
The Fed explains that PCE has broader coverage and adapts more quickly to changes in household spending patterns.
You can read the Fed’s explanation of the difference here.
So why does CPI move markets so much?
Because it arrives earlier, contains important information about consumer prices, and can materially change expectations for the later PCE data and for Fed policy.
The Fed watches CPI closely even though PCE is the official target measure.
Traders should understand both rather than treating them as interchangeable.
What parts of CPI deserve attention?
The headline numbers get the television graphics.
The components often tell the better story.
Energy
Energy can move headline CPI dramatically.
That is especially relevant right now because oil and fuel prices have been affected by geopolitical disruption.
A large energy contribution may be painful for households without necessarily proving that underlying inflation has become broadly entrenched.
But prolonged energy inflation can eventually feed into transport, manufacturing, food distribution and other prices.
So “it is only energy” is not always a reason to ignore it.
Shelter
Shelter carries an enormous weight in CPI.
That means relatively small changes in rent and owners’ equivalent rent can materially influence core inflation.
The BLS uses a rental-equivalence framework for owner-occupied housing, essentially estimating the rental value of housing services rather than treating house prices themselves as consumer inflation.
This methodology is important because housing inflation tends to move more slowly than market rents or house prices.
Services
Services inflation often receives close attention because it can be sticky.
Labour costs are a major component of many services, and service prices may not adjust downward as quickly as volatile goods or energy prices.
Persistent services inflation can therefore make policymakers more cautious.
Goods
Goods inflation can respond strongly to supply chains, tariffs, currency movements and global manufacturing conditions.
A broad acceleration in goods prices can signal something very different from a one-off rise in a small category.
The point is not to become an economist during the first five seconds after the release.
It is to understand that the composition can change the interpretation once the initial headline reaction settles.
Why the first move can be wrong
CPI releases are famous for violent whipsaws.
There are several reasons.
Algorithms react to the headline immediately.
Then traders see core CPI.
Then they see revisions.
Then they look at shelter.
Then services.
Then energy.
Then yields start moving.
Then Fed-rate probabilities adjust.
What looked like a straightforward “hot CPI equals dollar up” trade can become much more nuanced within seconds.
Liquidity can also deteriorate around the release.
Spreads widen.
Stops can slip.
Price can jump from one level to another without trading cleanly through every price in between.
That is why CPI is one of those events where being right about direction is not enough.
Execution risk matters.
A simple CPI scenario framework
Rather than trying to predict the exact candle, I prefer thinking in scenarios.
Scenario 1: headline hot, core hot
This is the clearest inflationary surprise.
Potential market interpretation:
- Fed tightening expectations rise
- Treasury yields rise
- dollar strengthens
- rate-sensitive equities come under pressure
- gold may struggle if yields and the dollar dominate
Scenario 2: headline hot, core soft
This is particularly relevant to the October 14 release because energy is expected to lift headline inflation.
Potential interpretation:
- first reaction may look hawkish
- market then focuses on whether the increase is mostly energy
- yields may retrace if underlying inflation looks contained
- dollar reaction can become mixed
- gold may whip sharply in both directions
Scenario 3: headline soft, core hot
This can be more concerning than the headline initially suggests.
Underlying inflation may be broadening even if volatile energy or food components temporarily suppress the overall number.
The market may ultimately treat this as hawkish.
Scenario 4: headline soft, core soft
This is the cleanest disinflationary surprise.
Potential interpretation:
- Fed-hike expectations fall
- yields decline
- dollar weakens
- rate-sensitive equities may rally
- gold may benefit from lower yields and a weaker dollar
Those are frameworks, not guarantees.
Markets can always react differently if positioning, geopolitics or another major development overwhelms the inflation story.
How I would approach trading CPI day
I do not think the goal is to prove how brave you are during the first candle.
The goal is to protect capital and trade a setup you actually understand.
Before the release, I would know:
- the exact release time
- the consensus forecast
- the previous reading
- whether I already have exposure on
- where my stop is
- what slippage could do to my real risk
- whether my account has news-trading restrictions
- what Treasury yields and the dollar are doing
- which technical levels matter after volatility settles
If I do not have a clear reason to be in the market during the release itself, I am perfectly comfortable waiting.
Missing the first 60 seconds is not the same thing as missing the trade.
Often the cleaner opportunity comes after the market has processed the data and structure starts to form again.
That is especially true if you are trading a funded account where one badly executed news trade can do disproportionate damage to your daily-loss limit.
If you need to review how much you are actually risking before an event, start with Position Sizing Explained: How Much Should You Risk Per Trade? and Stop Loss Placement: Technical Levels vs Random Numbers.
What I will be watching on October 14
For tomorrow’s September CPI release, I care about five things.
1. The monthly core number.
If core CPI comes in materially above the expected 0.2%, that would make the report much harder for the Fed to dismiss as an energy story.
2. The energy contribution.
Headline inflation is expected to accelerate sharply. I want to know how much of that increase is genuinely concentrated in energy.
3. Shelter and services.
If those categories accelerate at the same time, the underlying picture becomes more concerning.
4. Treasury yields.
The bond market will tell us very quickly whether traders think the report changes the expected path of rates.
5. The second move.
I am less interested in winning a race against an algorithm than understanding whether the market holds or rejects its first reaction.
That second phase often tells us far more.
The bigger lesson
CPI matters because inflation affects monetary policy, and monetary policy affects the price of money.
Once the expected price of money changes, almost every major market has to adjust.
Currencies reprice interest-rate differentials.
Bonds reprice future policy and inflation.
Gold reprices the opportunity cost of holding a non-yielding asset.
Equities reprice discount rates, margins and growth expectations.
That is why one number released at 8:30 in Washington can move markets around the world within milliseconds.
But the lesson is not that traders need to predict CPI.
It is that traders need to understand the chain of cause and effect.
Inflation data changes expectations. Expectations change yields. Yields change relative value. Relative value changes markets.
Once you understand that chain, CPI stops being a mysterious red-folder event on an economic calendar.
It becomes part of the market structure you are already trading.
And that is a much better place to start.
To your health, wealth, and happiness, always,
Chris